mohamad.63
کاربر فعال
نیاز به یک فایل اموزشیASPEN HYSYS2006 دارم لطفا کمک کنید.
این لینک رو ببینید البته برا ورژن 8 هستش
Hysys
نیاز به یک فایل اموزشیASPEN HYSYS2006 دارم لطفا کمک کنید.
سلامسلام
کسی فایل اموزش Aspen adsim فارسی نداره؟؟
سلام. بایستی مجموعه ای از داده ها در شرایط دما و فشاری جدید بعلاوه داده های آزمایشگاهی شرایط دمایی و فشاری دیگر (پایینتر) را پیدا کرده و با استفاده از Aspen Data Regression پارامترهای مدل را برازش کنین. چون با نرم افزار آشنا نیستین، کارتون طول میکشه متاسفانه. ضمن آشنایی با خود نرم افزار، شما مدل رو هم باید خوب بشناسین (نمیدونم مدل رو آشنایین باهاش یا نه!؟). درهر صورت میتونین بصورت پروژه تعریفش کنین و بدین تا بقیه انجام بدن (اگه عجله دارین)سلام
من تا حالا ار نرم افزار Aspen استفاده نکرده ام ولی الان مجبورم که برای قسمت بسیار کوچکی از پروژه پایانی ازش استفاده کنم. ممنون میشم اگه راهنمایی کنید من رو.
من یه معادله دارم برای حلالیت اکسژن در سیکلوهگزان که برای دما و قشار خاصی قابل استفاده است. حالا من مجبورم که از این معادله استفاده کنم اما دما و فشار آزمایش من بالاتر از دما و قشار داده شده برای این معادله است. استادم گفت چون معادله دیگه ای واسش نداریم باید همین معادله رو با Aspen Plus برای دما و فشار مورد نظرم برون یابی کنم.
کسی میدونه چجوری میشه این کار رو کرد؟
سلام. بایستی مجموعه ای از داده ها در شرایط دما و فشاری جدید بعلاوه داده های آزمایشگاهی شرایط دمایی و فشاری دیگر (پایینتر) را پیدا کرده و با استفاده از Aspen Data Regression پارامترهای مدل را برازش کنین. چون با نرم افزار آشنا نیستین، کارتون طول میکشه متاسفانه. ضمن آشنایی با خود نرم افزار، شما مدل رو هم باید خوب بشناسین (نمیدونم مدل رو آشنایین باهاش یا نه!؟). درهر صورت میتونین بصورت پروژه تعریفش کنین و بدین تا بقیه انجام بدن (اگه عجله دارین)
مدل خب همون مدلی که خودتون گفتین برای حلالیت دارین دیگه!!!سلام
ممنون بابت جوابتون. همون طور که گفتم چون با نرم افزار آشنایی ندارم منظورتونو از مدل نفهمیدم. اگه ممکنه لطفا مدل رو توضیح بدید یا یه لینک که در این باره توضیح داده رو بذارید.
میخوام ببینم چقدر طول میکشه خودم راهش بندازم. آخه به احتمال بسیار زیاد فقط این یه معادله نخواهد بود و معادلات بسیاری رو باید بعدا برون یابی کنم.
مرسی
سلام، آره فرق دارهسلام
بچه ها aspen polymer plus با aspen plus فرق داره یا همونه؟
ممنون میشم راهنمایی کنید
خیلی فرق داره؟ یعنی اگر کسی aspen رو بلد باشه و از پلیمر هم سر در بیاره میتونه با aspen polymer plus کار کنه یا نه؟
سلام بر مهندسین عزیز
یکی از عزیزان میتونه توضیح بده تکلیف ما با HYSYSو ASPEN چیه؟
یادگیری کدوم اولویت داره؟
تو ایران بیشتر کدومش بکار میاد؟
ببخشید که سوالم ماقبل آموزشه..
سلامسلام خدمت دوستان
کسی میدونه aspen one 7.3 چطور نصب میشه(روی ویندوز سون 64 بیتی)؟

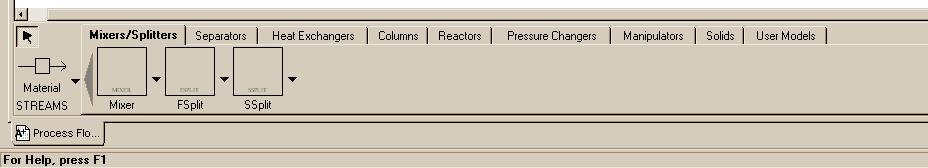
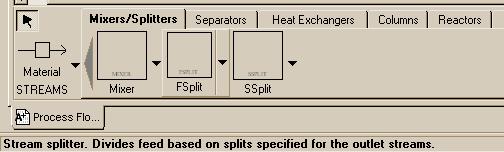
| Mixer - Mixes streams together. FSplit - Divides feed based on splits specified for the outlet streams.SSplit - Divides feed based on splits specified for each substream that may be entering the splitter. For example, an entering stream may be a mixed solid and liquid in the form of a slurry. The solids in the inlet may wind up preferentially in of of the exit streams from the unit. |
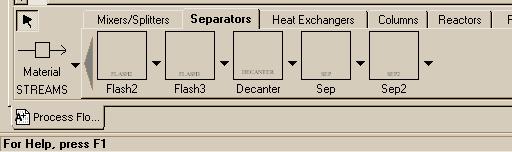
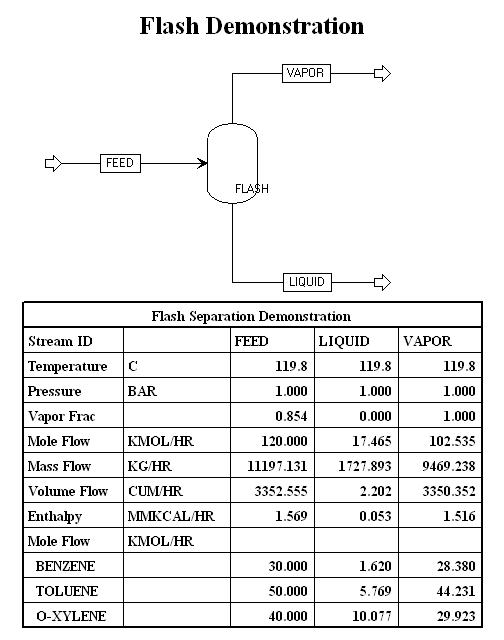
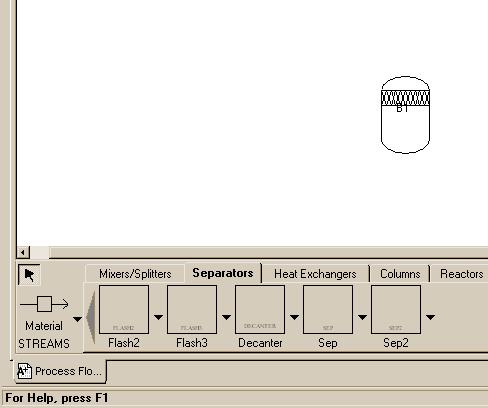
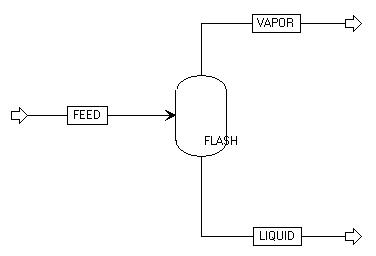
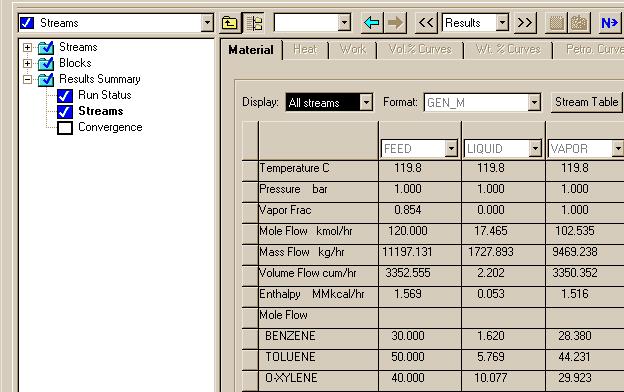
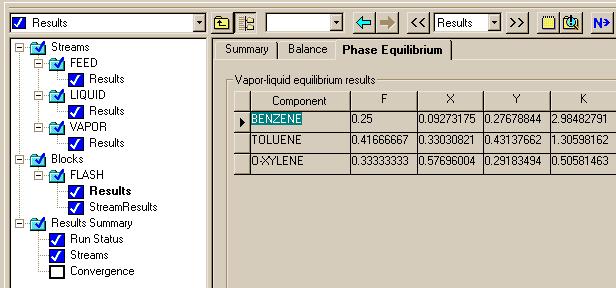
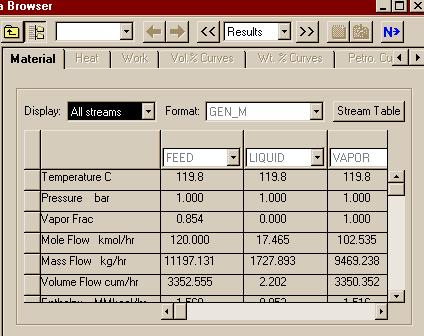
| Flash2 - Two-outlet piece of equipment that allows you to model flash separations based on vapor-liquid equilibrium. Flash3 - Three outlet flash for systems that might produce a vapor and two liquid streams Decanter - Separator with two liquid outlet streams Sep & Sep2 - General separators of compounents in a stream |
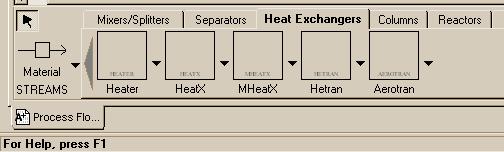
| Heater - Extremely simple model of a heat exchanger. Basically allows you to determine the energy requirements of changing a stream's temperature. HeatX - Models a two-stream co-current or counter-current heat exchanger. |
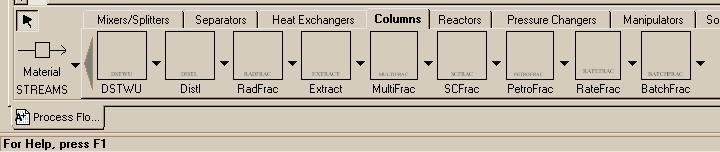
| DSTWU - One of two primary models of a distillation column. Of the two, DSTWU is the simpler, allowing you to model a column based on shortcut methods when you do not know many of the parameters. RADFRAC - Aspen's other model for a distillation column. Rigorous and complex, this model should only be used when you are extensively familiar with the system you are attempting to model. |
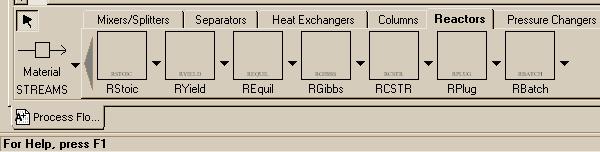
| RStoic - Models a reactor for given stoichiometry and extents of all reactions REquil - Models a reactor with some specified set of reactions assumed to be at thermodynamic equilibrium RGibbs - Models a reactor with minimum Gibbs Free energy RCSTR - Models a Continuous flow Stirred Tank Reactor (CSTR). RPlug - Used to model plug flow reactors. RBatch - Model of a batch reactor. |
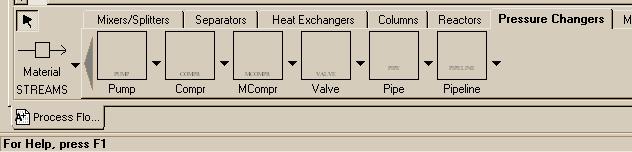
| Pump - Used when you need to simulate a pump in a flowsheet for transporting liquids. Compr - Polytropic or isentropic compressor for gases. |


|
|
|
|
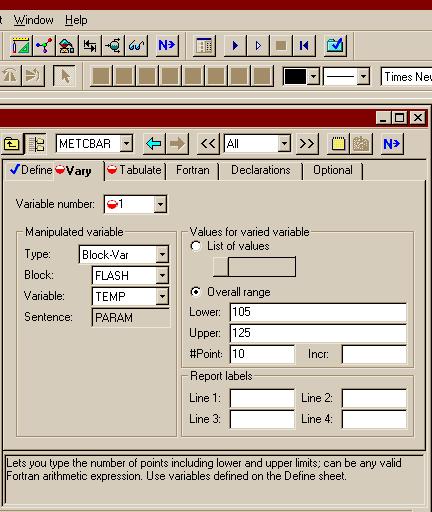
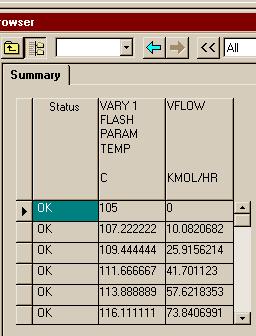
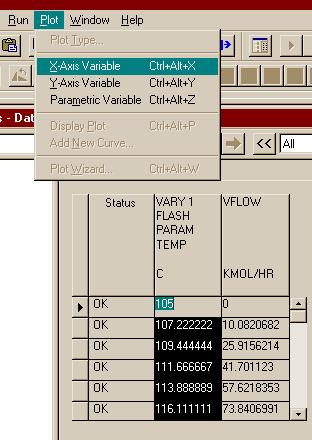
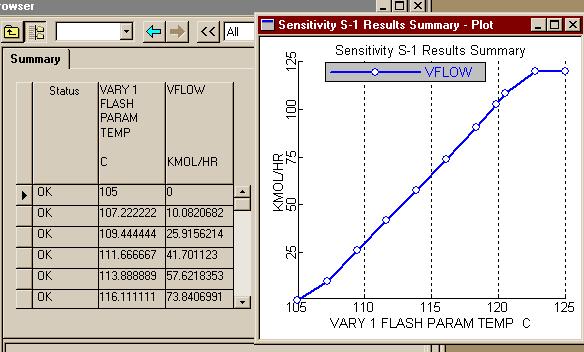
اره تا الان که اینطور نشون میده باید با رنج کار کرد تا جوابو بده.. در حالی که هایسیس اول ارور میده ولی با کمی تنظیم بدون استفاده از حالت بهینه اش جواب رو میده..فکر کنم باید یه رنج براش تعریف کنید و گام و بعد ران کنید من با هایسیس کار نکردم شاید خودش با توجه به اطلاعات ورودی یه تخمینی بزنه اما تو اسپن برای مواردی مثل پیدا کردن یه حالت بهینه باید رنج تعیین کنید فعلا جزوم در دسترس نیست و گرنه کامل میگفتم چه جوری
کتابی هست که اسپن یا هاسیس رو خیلی خوب و با مثال های به درد بخور یاد داده باشه ماشااله کلاسا زیر میلیون نیست.................
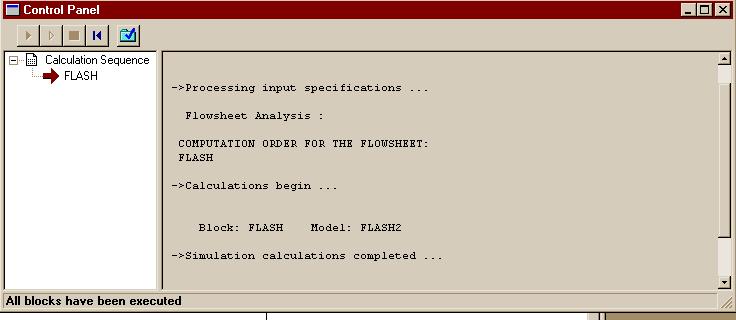
بله دوست من، برای حالت پیش فرض اسپن که SM (Sequetail modular) هست، همینجوریه. یعنی باید اطلاعات جریانهای ورودی و بلوک مشخص باشه، تا اطلاعات جریانهای خروجی رو بهت بده، البته این روش محاسبات رو میشه تغییر داد. ضمن اینکه در حالت SM برای بعضی بلوکها مثه مبدل حرارتی یه سری بلوکهایی تعریف شده که محاسباتی مانند حالتی که گفتین رو انجام میده...اره تا الان که اینطور نشون میده باید با رنج کار کرد تا جوابو بده.. در حالی که هایسیس اول ارور میده ولی با کمی تنظیم بدون استفاده از حالت بهینه اش جواب رو میده..
واسم جالبه که اسپن واس یک کار کوچیک باید رنج براش تعیین کنی... البته شاید دوستان روشی بلد باشند که نیاز به این کارا نباشه
بله دوست من، برای حالت پیش فرض اسپن که SM (Sequetail modular) هست، همینجوریه. یعنی باید اطلاعات جریانهای ورودی و بلوک مشخص باشه، تا اطلاعات جریانهای خروجی رو بهت بده، البته این روش محاسبات رو میشه تغییر داد. ضمن اینکه در حالت SM برای بعضی بلوکها مثه مبدل حرارتی یه سری بلوکهایی تعریف شده که محاسباتی مانند حالتی که گفتین رو انجام میده...
این یه نقص نیست، چون وقتی میری تو شبیه سازی فرآیندهای بزرگ، فقط نزدیک بودن اطلاعات جریانهای خروجی با داده های واقعی ملاک شبیه سازی قوی هست